
The relentless rise of social networks in recent years has made many marketers familiar with the concept of the social graph—data about how people are connected to one another—and its power in a marketing context.
Facebook’s social graph has propelled it to a projected annual revenue of around $40B for 2017, driven primarily by advertising sales. Advertisers are prepared to pay a premium for the advanced targeting capabilities that the graph enables, especially when combined with their own customer data; these capabilities will enable Facebook to snag over 20% of digital ad spend in the US this year.
Partly as a result of this, many marketers are thinking about how they can exploit the connectedness of their own customer base, beyond simple “refer a friend” campaigns. Additionally, it’s very common to hear marketing services outfits tack the term graph onto any discussion of user or customer data, leading one to conclude that any marketing organization worth its salt simply must have a graph database.
But what is a graph, and how is it different from a plain old customer database? And if you don’t have a customer graph in your organization, should you get one?
What is a graph database, and why should I care?
A graph database is a database that stores two things:
- A set of entities (such as people, servers, movies, or types of cheese)
- The relationships between the entities (such as friendships, memberships, ownership, or authorship)
In formal graph theory parlance, the entities are referred to as vertices, and the relationships edges. Whether someone uses one set of terms or the other is a good indication of whether they’re trying to impress you with their knowledge of graph theory (we’ll stick to the friendly terms above).
In a graph database, the relationships are first-class objects alongside the entities, with their own taxonomy and attributes, and it is this that makes graph databases unique. There are lots of types of database that can store information about things (the most common being our old friend, the relational database). These databases can be pressed into service to capture relationships indirectly (in RDBMS systems, through primary/foreign key pairs), but graph databases provide a much more explicit and simple way of capturing and, more importantly, retrieving relationship information.
The diagram below provides a simple example of a graph—in this case, one that captures Twitter-style ‘follow’ relationships between people. The circles in the diagram are people, and the lines are the relationships. Note that each relationship has a direction.

The graph database makes it easy to get the answers to the following kinds of question:
- Who does Andrew follow? (Barbara and Cynthia)
- Who are Barbara’s followers? (Andrew and Cynthia)
- Who do the people who Andrew follows follow? (Barbara and Donald)
- Who are Donald’s followers’ followers? (Andrew and Cynthia)
You can see how this kind of data is essential in providing a service like Twitter: When Andrew logs in, he wants to see the tweets from the people he follows, while Barbara can see how many followers she has. But the graph also makes it possible to make a suggestion to Andrew: Because Andrew follows Barbara and Cynthia, and they both follow Donald, Twitter can suggest that Andrew also follow Donald. This ability to explore indirect relationships is a key value of graph data.
Because a lot of marketing is about people and relationships, there are several ways in which graph data, particularly user graph data, can be useful for marketers, including:
- Recommendation services
- User identity matching
- Community detection (tribes)
- Commercial account management
In the rest of this post, we’ll take a look at these scenarios in a little more detail, and then look at some things to bear in mind if you’re thinking about investing in graph database technology.
Graph-based recommendation services
One of the best (and most well-known) applications for graph data is a recommendation engine. By capturing the relationships between users and the products they have purchased in a graph, companies like Amazon are able to recommend products based on the purchase behavior of others.

The graph above is more complex than the first example because it captures two kinds of entity (customer, in blue, and product, in green) and two kinds of relationships (purchase and ‘like’ – analogous to a 5-star product rating in this example).
Based on the graph, we can see that Andrew has purchased (and liked) a widget. Barbara and Cynthia have also both purchased a widget, and additionally have each purchased both a sprocket and a doodad. So a simple recommender system could use this information to suggest to Andrew that he should buy one of these products.
However, with the extra level of detail of the ‘like’ relationship, we can see that Barbara and Cynthia both like the Doodad – and that additionally Cynthia likes the widget she bought. So it is possible to make a more relevant recommendation – for the doodad. This is also known as collaborative filtering.
A simple (but significant) enhancement of such a system is to capture user behavior (especially in response to recommendations) and feed it back into the graph as a new layer of relationships. This feedback loop means that the recommendation engine can become an unsupervised machine learning system, continually optimizing recommendations based on not just similarities in purchases, but how users are responding to the recommendations themselves.
Pinterest’s Pixie is a good example of a graph-based recommendation system. This deck from Brazil-based retailer Magazine Luzia talks about how they built a recommendation system on AWS.
Identity matching
Matching sets of user data that do not contain a common, stable identity signal is a challenge for many organizations, and is only getting more challenging as devices proliferate; fortunately, graphs offer a solution here.
A graph database can model the indirect relationships between IDs through tracking the relationships between those IDs and the contexts they are seen in. In the diagram below, three distinct IDs (ID1, ID2 and ID3) are seen in combination with different devices (in green), apps (in orange) and geo locations (in grey). Using the graph, it’s possible to calculate a simple ‘strength function’ which represents the indirect relationship between the IDs, by counting the number of entities they have common links to.

Per the diagram, the relationship strength function (we’ll call it S) for each pair of IDs is as follows:
- S{ID1, ID2} = 2
- S{ID1, ID3} = 4
- S{ID2, ID3} = 3
On the basis of this function, one would conclude that ID1 and ID3 are most likely to belong to the same actual user, or at least users that have some sort of commonality.
A more sophisticated version of the graph has numeric values or weights associated with the relationships – for example, the user/app relationship might capture the number of times that app has been launched by that user. This enables the strength function to achieve greater accuracy by weighting some connections more than others.
A further enhancement is to apply machine learning to the graph. The various relationships between two IDs, and their intrinsic weights, can be thought of as a set of features to build a predictive model for the likelihood of two IDs actually belonging to the same person. A set of known connected IDs can then be used as a training set, with the ML algorithm adjusting a second set of weights on the relationship edges until it achieves a high-quality prediction, and is able to provide a probability for each identity pair belonging to the same actual user. This is roughly how solutions like Drawbridge’s Connected Consumer Graph and Tapad’s Device Graph work.
This kind of probabilistic identity mapping enables marketing delivery systems to treat highly similar IDs as if they belong to the same user, even if they do not in practice. Obviously, deterministic identity mapping (where user data is joined on common keys) is better, but in cases where that is not possible, a graph-based approach can provide an efficient way of extending an audience to a new channel where good ID coverage is scarce.
Community detection
A third marketing application of graphs is community detection. This is a type of clustering that looks for communities or ‘cliques’ of highly interconnected individuals within a population:
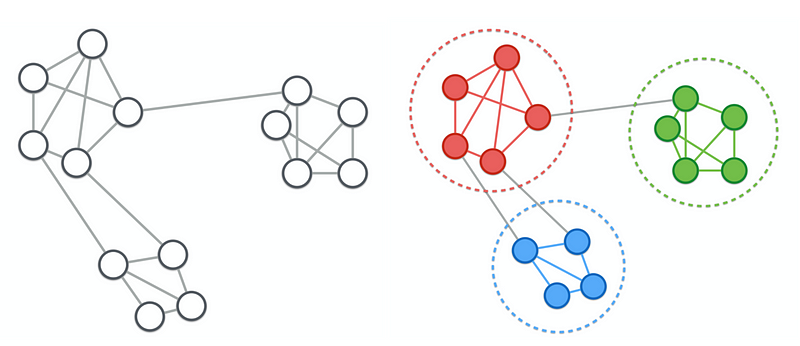
The clusters that result from this kind of analysis represent customers who are highly connected to each other; targeting these users with social or word-of-mouth campaigns can then drive above-average response rates.
A graph-based approach to this problem is useful when the clusters or communities are not of equal size, and where there may be an uneven distribution of connectedness within the clusters. As with some of the other scenarios I’ve described, using a graph representation of the data isn’t the only way to solve this problem, but it can be the most efficient.
This article provides some interesting insights into how the diversity of Twitter users’ networks can have an impact on their ability to generate creative ideas.
Commercial account management
Commercial or Enterprise account management is all about tracking relationships – relationships with individual decision-makers, the organizations that they represent, and other information such as the decisions those people are responsible for, the role they have, and so on.
Graphs are very well suited to tracking this kind of information, making it possible for account managers to identify strategies for closing new business. Take the following example graph, of companies, individuals who work for them, and products those companies use:

This graph enables the following conclusions to be drawn:
- GM uses Product A and Product B
- Andrew Smith, who works for Ford, used to work for GM, which uses Product B
- Barbara Jones, who used to work for Ford, specializes in Product B
Based on the above insights, the account manager for Ford, who is trying to sell in Product B, might decide to speak to her account manager colleague for GM to ask if she can connect Carl White with Andrew Smith, so that Carl can talk about his experiences with Product B. Given that Carl and Andrew have both worked at GM, they may even already know each other.
In selecting a partner to work with Ford on the implementation of Product B, the Ford account manager would be wise to speak to Barbara Jones at ABC, since the graph shows that ABC has worked with Ford before, and so has Barbara.
This HBR article provides some more detail on the use of social graphs for business.
Getting started with graphs
If one of the above use-cases for graph data has caught your attention, here are some ways to get started with building a customer graph dataset.
Before you start
Before you go to the trouble and expense of building your own graph database, you do need to have a fairly good-quality set of customer data with attributes that you can use to connect those customers together. A sparse graph that is a series of poorly-connected islands will not be very useful.
You should also think about whether your business and data lend themselves to the kinds of connected applications listed above. For example, if your customer base has very diverse needs, then a recommender service may not be very useful. Similarly, if your customer base is small, then an in-house graph solution may be overkill; you may benefit from connecting your customer base to one of the public graph offerings below.
Graph databases
If you’re looking to build your own graph database, there are a number of commercial solutions available:
If you’re already managing your data in the cloud, you’ll want to pick a graph data solution that works with your cloud provider – Datastax, for example, partners with Microsoft for hosting on Azure, and Google’s cloud platform. Before you are able to leverage your graph data, you’ll need to both define your graph schema and load data into the graph – look for an implementation partner that can help you with both of these things.
To work with graph data, you’ll need to learn a graph query language. The most popular graph query language is Gremlin (part of the TinkerPop stack), though other query languages exist (for example, Neo4j has its own query language, called Cypher). Again, an implementation partner who already has graph coding skills will be a valuable resource here.
Customer and ID graphs
If you’re not ready to manage your own graph dataset, there are many companies offering graph-based services around customer and identity data. In fact, most DMPs today will tout a customer graph as core to their solution. Establishing whether such offerings truly are customer graphs rather than identity graphs (i.e. whether they provide relationship information between customers, not just between IDs) should be one of your first questions if you’re being pitched on these solutions.
Some of the key offerings are:
- Signal Customer Identity Platform
- Oracle ID Graph
- LiveIntent
- Adobe Audience Manager
- LiveRamp
- Drawbridge Connected Consumer Graph
- Tapad Device Graph
- Facebook Graph API
Even if you don’t end up implementing a graph database, graph-style thinking is a valuable step in data design; one of the pleasing benefits of graph databases is that their structure closely mirrors the way that humans tend to think about data and systems. Thinking about your customer data as a graph can therefore help you unlock insights from your existing data.