
There’s a lot of buzz about Data Science these days, and especially its super-cool subfield, Machine Learning. Data Scientists have become the unicorns of the tech industry, commanding astronomical salaries and an equal amount of awe (and envy) to go with them. Partly as a result of this, the field has developed something of a mystical aura – the sense that not only is it complex, it’s too complex to explain to mere mortals, such as managers or business stakeholders.
It’s true that mastery of Data Science involves many complex and specialized activities, but it’s by no means impossible for a non-Data Scientist to build a good understanding of the main building blocks of the field, and how they fit together.
There are many good reasons to do this, but here are three: First, if you work with Data Scientists, it helps to understand some of the foundations of the work they do, so you can interpret their work more effectively. Second, if you are hiring Data Scientists, this knowledge will help you to select the right people and manage them more effectively, even if you’re not deep in the technical weeds yourself. And third, Data Scientists often benefit from being paired with laypeople who can understand their work and help bring their ideas and findings to a broader audience.
In my time at Microsoft I’ve spent a lot of time working with and managing Data Scientists, as well as more traditional analyst roles, and I have found that a working knowledge of Data Science concepts has been invaluable. In this series, I’ll cover a number of key Data Science topics from a business/non-technical standpoint, including:
- What do Data Scientists do all day?
- How is Data Science different from Analytics?
- Getting, cleaning and preparing data
- Statistics and causality
- Predictive modeling & machine learning
- Experimentation & optimization
- Tools & technologies
- Data visualization
- Bias and ethical considerations
- Managing a Data Science team
What is Data Science?
Much ink has been spilled on the debate about whether a certain specific activity (say, data visualization) is or is not Data Science; what is clearer is what the purpose of Data Science is: To find patterns in data, and to use these patterns to understand the world, and make predictions about it.
As a species, we are excellent at finding patterns, and owe much of our success to this ability (though we are also very good at seeing patterns where they don’t exist, so good in fact that there is a term for this: pareidolia). Pattern recognition helps us to understand the world and make predictions about it. Take the old saying:
Red sky at night, shepherd’s (or sailor’s) delight;
Red sky in the morning, shepherd’s warning.
This rhyme encapsulates a description of a pattern—red sky at a certain time of day—and uses that pattern to make a useful prediction about the weather in the future (as it happens, this prediction has a sound scientific footing).
The Data Science Process
It’s one thing to make a simple prediction about the weather based upon just a couple of factors; it’s quite another to sift through hundreds of variables to predict who is most likely to buy a particular product, or understand why website visits spiked last month.
To achieve this, Data Scientists need to identify, gather and understand the data that is available, prepare it so that it is useful for analysis, build models that highlight patterns in the data, use these models to make predictions or explain the data, and visualize the outcome.
It is really this process which is the best definition of what Data Science is – a connected set of activities that take raw data and turn it into insights and predictions. Back in 1996, a consortium of organizations that included SPSS, Teradata and Daimler created the Cross-industry Standard Process for Data Mining, or CRISP-DM, which provided a standard framework for these activities. CRISP-DM comprises six major steps, from the initial phase of understanding project needs all the way through to a deployed model. In the intervening years the now painfully unfashionable term “Data Mining” has been replaced with the achingly hip “Data Science”, but CRISP-DM describes the Data Science process very well.
For the purposes of this discussion, I’ve created a slightly modified CRISP-DM model which I think captures an important seventh step: presenting the results of the work. Not all Data Science work gets ‘deployed’ in a traditional sense – much of it results in analytical readouts to key stakeholders. So my modified process looks as follows:
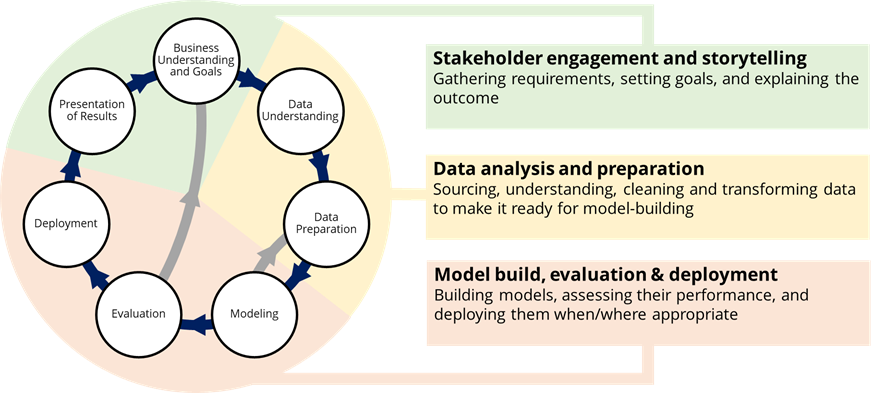
As you can see, the seven individual process steps really break down into three major phases of work:
Stakeholder engagement and storytelling: This activity phase bookends the project; at the start, it’s all about clearly defining and understanding the goals of the project, while at the end, it’s about getting back in front of the stakeholders who commissioned the project in the first place to deliver insights and explain whether the goal has been achieved and any insights gained along the way.
To achieve success in this area, the Data Scientist needs to be able to work with stakeholders to understand their needs, which involves being able to ask good questions and probe for clarity. But they also need to be able to build a story around the outcome of the work, probably using data visualization tools like Power BI or Tableau.
Data analysis and preparation: Most Data Scientists will tell you that this is where they spend most of their time (up to around 80% of a project). First, the Data Scientist gathers and evaluates the data that is available that describes the outcome they are trying to model—e-commerce transaction data, hospital patient records, or industrial accident data, for example—and any other data that may provide useful context, such as seasonality information, weather data, or competitive data.
The data preparation step sees the Data Scientist cleaning, joining and transforming the data to make it easy to analyze and build models against. For even well-formed datasets, this can still be time-consuming because it involves a lot of iterative work to remove outliers and otherwise make the data ready for modeling.
Model build, evaluation and deployment: To most people, this is where the Data Scientist weaves magic, leaning on their PhD in Computational & Statistical Analysis to do a bunch of clever math and create a great model out of thin air.
The reality is somewhat more prosaic—firstly, the Data Scientist will spend considerable time analyzing the data manually to identify significant features and correlations that will lead to a good model, before they even build and test any models. Data analysis languages like R and Python are very useful here because they allow the Data Scientist to analyze many dimensions of the data easily and quickly.
The process of building, evaluating and improving models is an iterative one; the Data Scientist will likely try several different model algorithms (which we’ll come to in a future post), tuning each one to improve its performance, and will repeatedly go back to the data preparation step to adjust the data itself.
There is no magic point where the Data Scientist shouts “Eureka!” and runs down the street naked. The model is ‘done’ when the Data Scientist has wrung as much performance improvement out of the model as possible without making it overly complex or hard to understand. Depending on the goal of the modeling activity, this balance of accuracy and complexity will vary – for example, a model to predict which patients will go on to develop cancer needs to be a lot more accurate (strictly, have better recall) than a model that predicts who is likely to buy the new Starbucks Unicorn Frappuccino.
Deploying the model can mean a couple of things; for example, a model to predict hard drive failure in PCs could be deployed as code into the PC’s Operating System. However, there is also the option of simply ‘deploying’ the model output, as well as the insights generated by the creation of the model, as an analytical deliverable to the project’s stakeholders for some other action to be taken.
Rainbows and Unicorns
So it is clear that the main characteristic of Data Science is breadth – the Data Scientist needs to be able to master a range of activities, encompassing and extending what we would traditionally consider analytics (more on this topic in the next post in this series). Josh Wills succinctly summed this up in a tweet all the way back in 2012:
Data Scientist (n.): Person who is better at statistics than any software engineer and better at software engineering than any statistician.
— @spite.vc on bluesky (@josh_wills) May 3, 2012
Individuals who are truly excellent at all aspects of Data Science are extremely rare, since they draw on very different skills. Rather than hunt for unicorns (which is both time-consuming and expensive), it makes more sense to hire a range of individuals with complementary talents across the Data Science spectrum. We’ll cover this in more detail in the next post, Data Science vs Analytics.
Data science is a “concept to unify statistics, data analysis, machine learning and their related methods” in order to “understand and analyze actual phenomena” with data.
I had done Data Science course from TGC India. They offer a variety of tutorials covering everything from the processes of Data Science to how to get started with Data Science.