
Ask any Data Scientist and they will tell you that the process of ‘wrangling’ (loading, understanding and preparing) data represents the lion’s share of their workload – often up to as much as 80%. However, that number is not as alarming as it may at first seem. To understand why, let me tell you about my living room.
A few years ago, I had the main room in my house repainted professionally. The work took about a week, but the painter spent the first three days doing a whole lot of work that wasn’t painting – cleaning the walls, sanding, filling small holes and cracks, and carefully masking off the areas that needed to be painted. Once she’d been at this for three days, I asked her politely if the project was going to over-run because we were already at Wednesday night and she hadn’t painted a thing. She told me that the actual painting part took almost no time – it was the prep that was the time-consuming part. And sure enough, the next day she came in with a spray gun, and by the end of the day the entire room was painted beautifully.
The data wrangling that a Data Scientist does is somewhat similar. It seems like it’s just preparation work for the “real” work of building models, but in fact it is a big part of the work – the key to building models that run successfully and give good predictions is having well-formed, clean data that a computer can work with effectively.
There are multiple steps to get data into a state where it can be used for modeling:
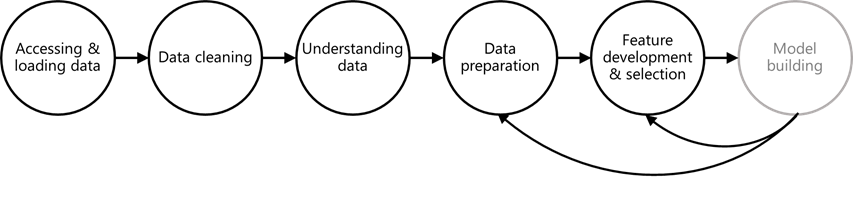
The qualitative nature of these tasks is quite varied. The first three tasks are quite deterministic, concrete tasks – making sure the data is at hand and doesn’t have giant holes in it. By contrast, the latter steps are much more subjective and are performed iteratively as models are developed – a Data Scientist will typically build and run a model against a basic clean set of data and then look for ways to improve the performance of the model.
Let’s look at each of these tasks in a little more detail:
Accessing & loading data
Many data professionals, not just Data Scientists, are familiar with the challenges of getting hold of data in the first place, from instrumentation and website tagging through to issues of data access and transport. In some cases, the data for a piece of work will come from many disparate sources and will need to be joined together, a process which itself can take a considerable amount of time.
For large-scale Machine Learning projects, the data may reside in a data lake such as Hadoop and may need to be extracted (and possibly transformed along the way) using a language like Pig Latin or HiveQL, so Data Scientists may need to know a little of these scripting languages (similar to SQL) to get to the data. Certainly some SQL knowledge is essential, as a lot of useful data is typically locked up in enterprise data warehouses.
At Microsoft our Data Scientists would frequently write scripts to extract data to a local SQL database and then use that data for model-building, often then leaving the copy of the data sitting on a server underneath their desks. GDPR made it necessary to be a little more rigorous in deleting this data once it had been used for its intended purpose. We’ll cover data governance and management in a future post.
Data cleaning
Once the data is available, the sometimes-arduous task of cleaning it takes place. Whole books have been written about data cleaning, as it is a huge topic; it is particularly important to have clean data for modeling and Machine Learning because computers are not smart enough to know what to do with data that is missing, duplicated, or incorrect.
There is an art as well as a science to data cleaning. Take the example of a dataset that includes a temperature value (say, from an industrial sensor). If some significant fraction of records are missing this value, how should these be handled? The missing values cannot simply be set to zero, since zero is a real temperature, which would skew the model. But excluding temperature altogether may significantly reduce the effectiveness of the model in cases where it is present.
A special class of data cleanliness challenges is user or customer data. Building a customer data set which draws on multiple data sources and is a good, disambiguated representation of customers at the individual level is a significant investment for an organization, which is why there are so many companies out there selling Customer Data Platform solutions. Data Scientists typically can’t handle this work on their own; they need to partner with Data Engineering teams who are building these assets to ensure that the quality and cleanliness of the data is high (or at least known). My own team at Microsoft spent five years building a high-quality Customer Data Platform, which was then used by Data Scientists as the basis for a wide range of predictive models.
Understanding the data
The real core of what most Data Scientists do day-to-day is figuring out how the data that they have can be used to support the task they’ve been given, whether that’s to predict the next quarter’s sales, identify potential failures in industrial machinery, or create target audiences for digital marketing. Getting a ‘feel’ for the data is essential to this. In this step, the Data Scientist spends time looking for patterns and correlations within the data that may help them to intuit which data attributes (‘features’, in the parlance) will be most useful for building their model.
To achieve this, Data Scientists will use the charting capabilities of R (ggplot) or Python (matplotlib) to rapidly create multiple visualizations of the data so that patterns between the features, and between the features and any data attributes (‘labels’) that the model is trying to predict. They will also look at the distribution of values within a particular feature – if the values in a feature are very non-linearly distributed, then that feature may not be so useful for model-building, or may need to be manipulated (for example, by converting it into a logarithmic scale).
Good subject-matter knowledge of the domain being studied is essential for Data Scientists in this step. For example, they may discover that web visit data shows that visit duration tails off sharply towards the end of the day. A Data Scientist with domain knowledge may question whether this is caused by visits being automatically terminated at midnight. As another example, a Data Scientist working with Retail data needs to know that certain days of the year (such as Black Friday) represent very significant outliers and have a plan to deal with them.
Preparing the data
A reasonably clean set of data still needs to be prepared before it can be used for model-building, because the math of Machine Learning models can easily be tripped up by unexpected or outlier values. This preparation will typically include:
- Normalizing numeric values so they all fall in the same range (e.g. zero to one)
- Sampling the data to reduce its size for training
- Oversampling (duplicating) positive records where these are sparse in the data
- Bucketing continuous values (e.g. age groups) to create categorical values (or vice versa)
- Removing outlier values
Again, R or Python are the typical tools that are used to perform these tasks. This step isn’t by any means the only data-manipulation step the Data Scientist will perform – they will also undertake significant Feature Engineering work, to create more useful ‘features’ in the data for the model. I’ll cover that below.
Feature Engineering and Selection
The final data wrangling step is arguably the most important, since it is the step when the Data Scientist manipulates the data in creative ways to improve model performance and generalizability. Feature Engineering refers to the process of creating additional fields (features) in the data that may help with prediction. Here’s an example: A Data Scientist is working with historical customer purchase data to create a predictive model of future purchase behavior. From the raw purchase data they can create several new features: Number of purchases in the last 7 days, number of purchases in the last 30 days, value of purchases in the last 7 (or 30) days, value of the most recent purchase, and so on. These new features can then be used to train models, and their impact on model performance assessed.
Another big subcategory of Feature Engineering is the extraction of descriptive features to enable classification of text (e.g. to extract topics from a set of web pages), often through a process known as vectorization.
Feature Selection is the process of winnowing out features that have little net impact on the predictive power of a model. The challenge of all modeling exercises is to find a model that performs sufficiently well, using as few features as possible. A model that uses many features may perform slightly better on the training set, but fail to generalize well on new data. There are various mathematical and algorithmic approaches to feature selection, but ultimately it is down to the Data Scientist to make an expert judgment about which features to include and which to exclude to strike the right balance.
It (almost) goes without saying that this final step is highly iterative with the process of building and testing the models themselves. We’ll cover this part of the process in the next post.
3 thoughts on “Demystifying Data Science, Part III: Data Wrangling”
Comments are closed.